At a special meeting held remotely on June 17, 2024, Councilor Rothenberg presented a budget map for school funding to City Council members, Mayor Sciarra, and City Finance Director Nardi. Councilor Rothenberg invited Northampton resident Al Simon to present at the meeting.
June 17, 2024 Video Recording: Northampton Open Media
I moved to Northampton five years ago from Windsor, Connecticut. There, I was an elected member of the Town Council for 18 years. Six of those years were as Deputy Mayor, and for 12 of those years, I was the chair of the finance committee.
There are a lot of similarities between Windsor and Northampton, but some differences too. One difference is that we had a “town manager” form of government, so the Town Council was the highest authority. We employed the town manager and provided oversight. He worked for us, and we had the final say on the budget, which we could increase as we felt appropriate.
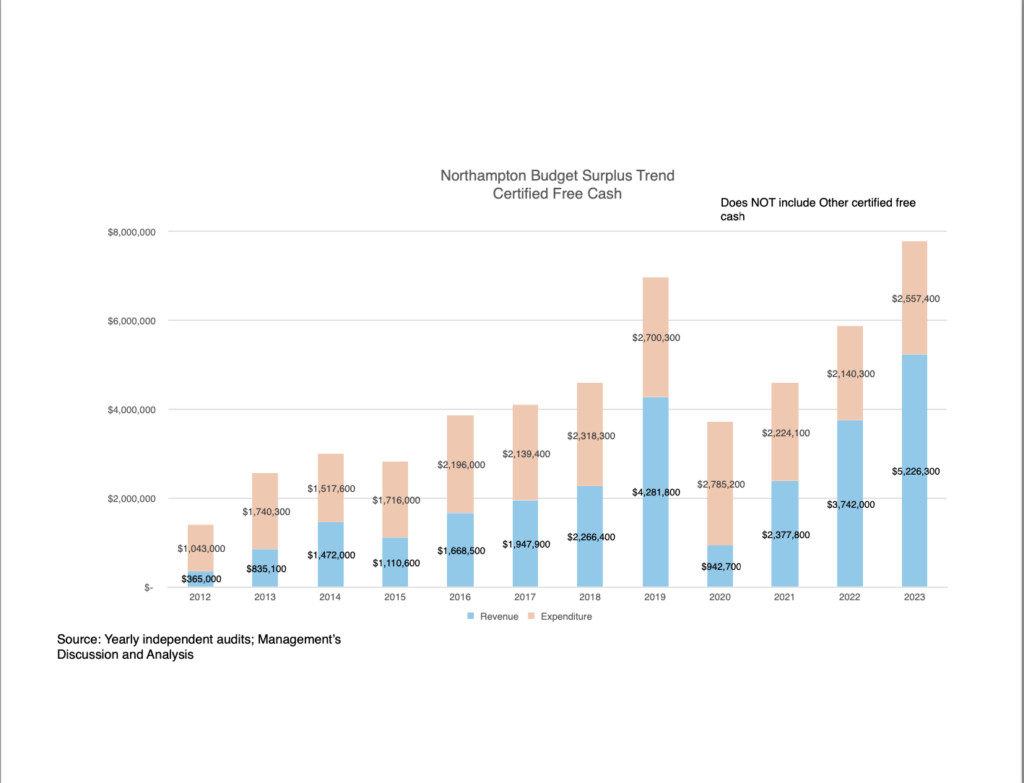
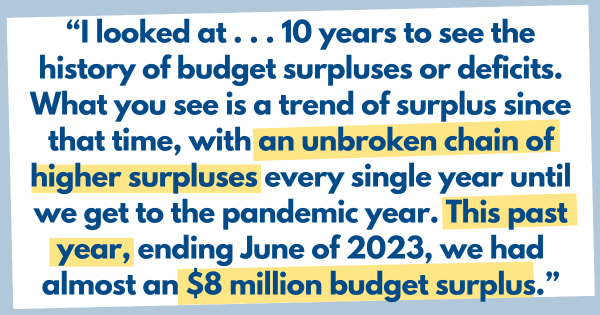
There’s been a lot of talk about a deficit from the mayor. The status of Northampton is actually the opposite of a deficit: it is surplus, surplus, surplus, surplus. I looked at the independent audit and went back to 2012. That was an arbitrary figure; I wanted at least 10 years to see the history of budget surpluses or deficits. What you see is a trend of surplus since that time, with an unbroken chain of higher surpluses every single year until we get to the pandemic year. This past year, ending June of 2023, we had almost an $8 million budget surplus.
The chart you’re looking at has two components: I looked at the revenues and the expenditures. The number at the bottom in blue represents the amount of revenues over budget, meaning we underestimated the revenues. The number on top is the amount of expenditure that we had budgeted but did not spend. Since 2016, our budget surplus has been about $4 million or higher every single year except for the COVID year of 2020.
You cannot have a deficit and a surplus at the same time. This surplus is certified by the state of Massachusetts and our independent auditors, and I have every reason to believe that it is correct.
COUNCILOR ROTHENBERG: Do these figures include ARPA money?
No, this does not include ARPA money. This is strictly revenues and expenditures, not any other certified free cash. So, the real number is even higher than this.
So then I wanted to look at the actual amount of cash that we have.
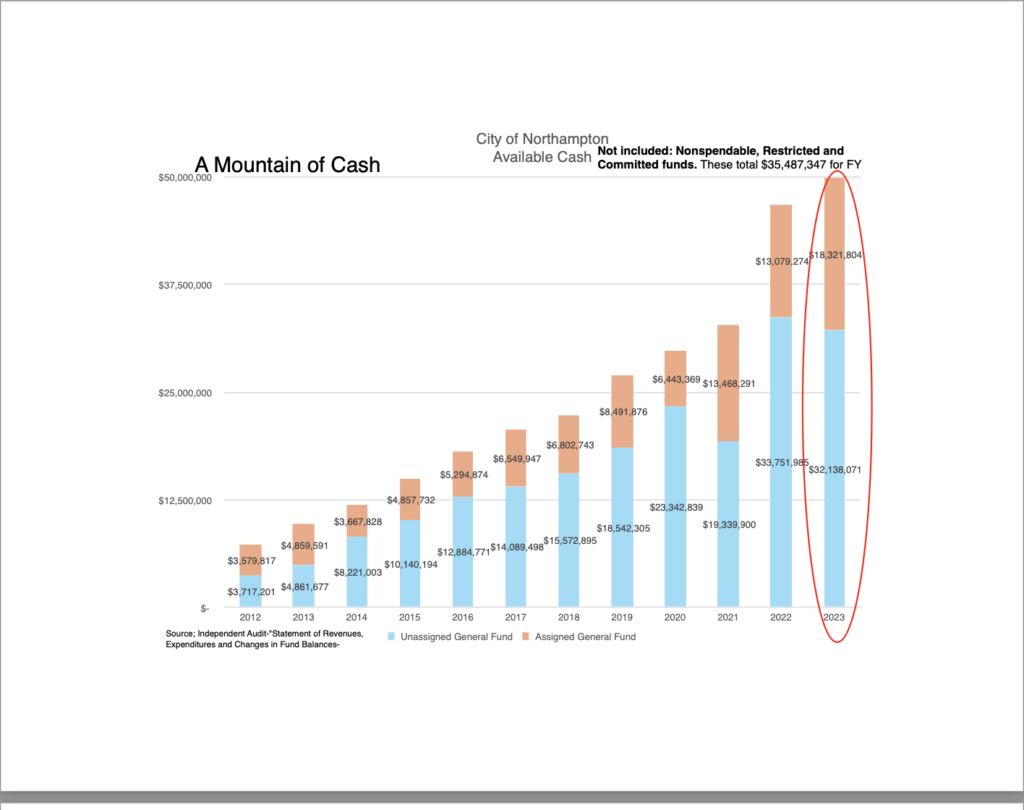
This is cash on hand. And I’ll be honest with you: I’ll probably run out of adjectives to describe how astounding the amount of cash Northampton has. I’ve called it here a “mountain of cash” because it’s truly an extraordinary figure, based on my experience. You can see how successful the stability plan was over time in putting money into savings accounts.
There are two figures here: the first, the bottom number in blue, is what’s called the unassigned general fund, where the stabilization accounts are; the number at the top, the brownish color, is the assigned general fund. That is money that has been moved with the intent to be spent in certain ways but has not yet been spent.
All of this money, every single dollar, remains under complete city control. The city can change what it’s spent on if it wants to. Some appropriations will require five votes from the council, some will require six; but the point is it’s completely under city control.
That mountain to the right totals $50 million. There’s an additional $35 million in cash that is not on this chart because there are restrictions tied to that money, so it is not completely under city control.
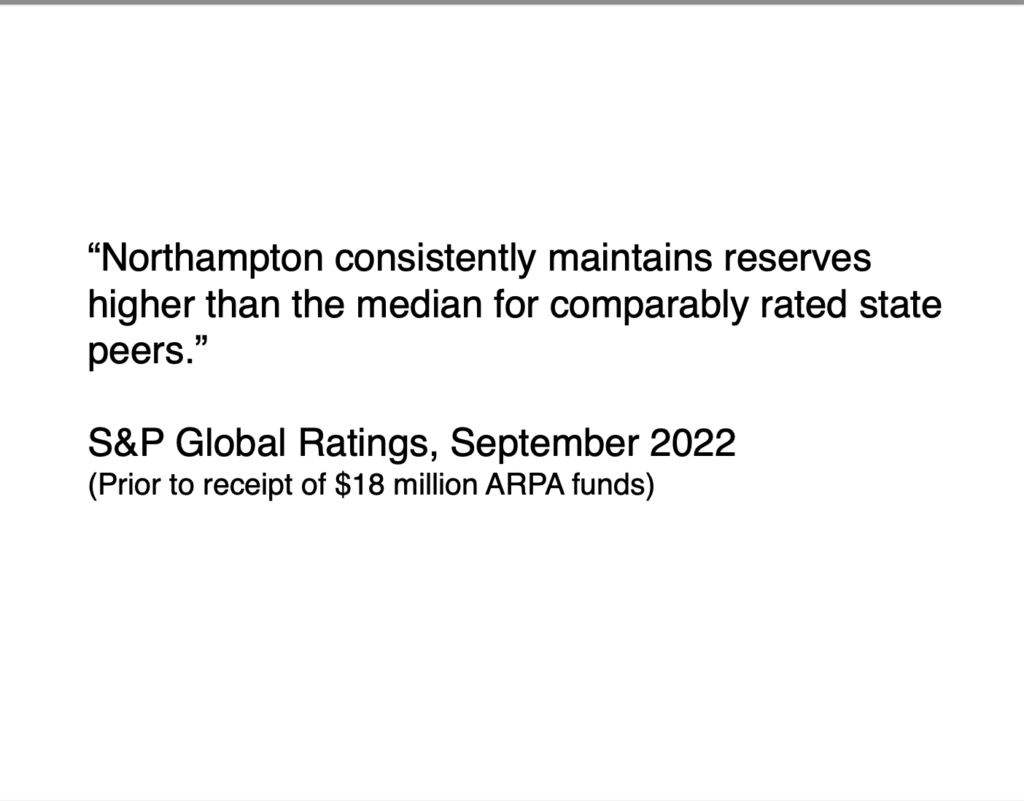
As you know, our bond rating agencies give us reports every once in a while. The last report available, which is online on the city’s website, had this interesting comment from September of 2022: “Northampton consistently maintains reserves higher than the median for comparably rated state peers.” This puts us in the top 50% by that statement, and that is prior to the receipt of the ARPA monies, which just blew the top off the total savings.
I decided to try to find some comparison data.
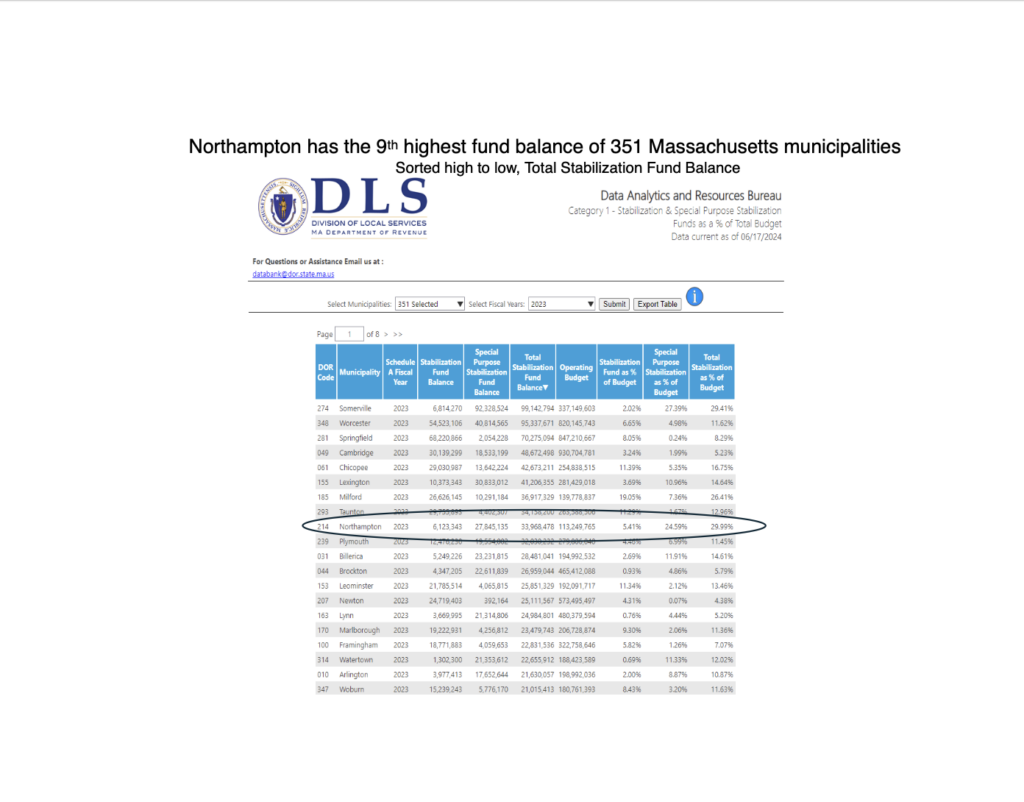
I was able to find a website for the Division of Local Services for the Massachusetts Department of Revenue. They have a great database that you can sort and filter. I decided to sort it by total stabilization fund balance, from high to low. What did I find? Northampton has the ninth highest total fund balance of 351 Massachusetts municipalities. That’s incredible for a town of this size.
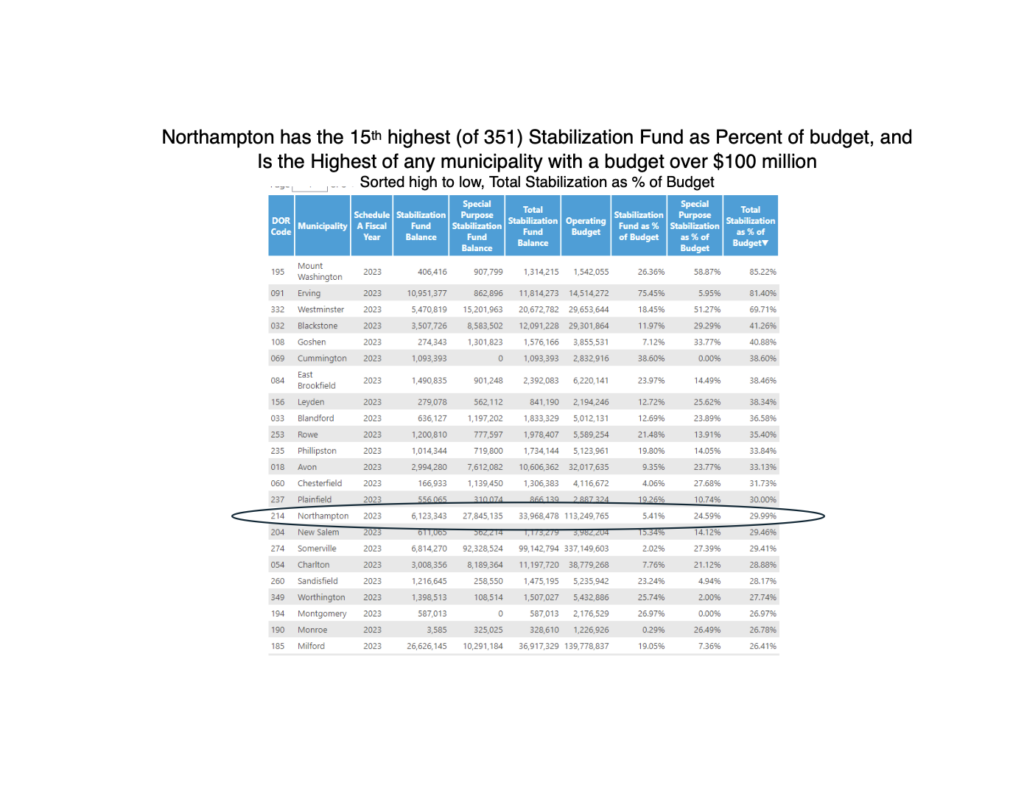
I sorted again by total stabilization funds as a percentage of budget. If you look at our fund balances as a percentage of the total budget, what you’re going to find is that Northampton is now 15th highest out of 351 municipalities for having cash on hand as a percent of budget.
And if you look a little closer and only consider cities with budgets of a hundred million dollars or more — and there are quite a few: at least 25% of the municipalities are hundred million or over — for communities with a $100M-or-over budget, we are first in percentage of cash against budget. That is astounding for a town of this size.
What it looks like to me is: the stability plan has had a priority to generate cash, and it has done it very successfully. Unfortunately, the stability plan is not providing sufficient recurring funds to the Northampton public schools, and that is why we’re having this discussion.